
Hydrologic Data Analysis with hyswap
During my time at the USGS, the Water Mission Area was focusing on open-sourcing and modernizing software tools and methods. Consequently, I led the initial development of the HYdrologic Surface Water Analysis Package, hyswap.
The package was designed to be function-based, as opposed to object-oriented, to be approachable to the many R-users prevalent in the USGS and the hydrologic community. A number of methods to calculate and visualize common hydrologic statistics are included. Examples of the package’s functionality typically make use of the Python dataretrieval package to fetch USGS water data.
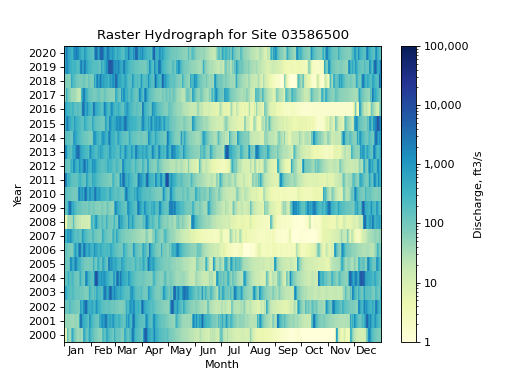 |
|---|
| Example raster hydrograph as generated by the hyswap package |
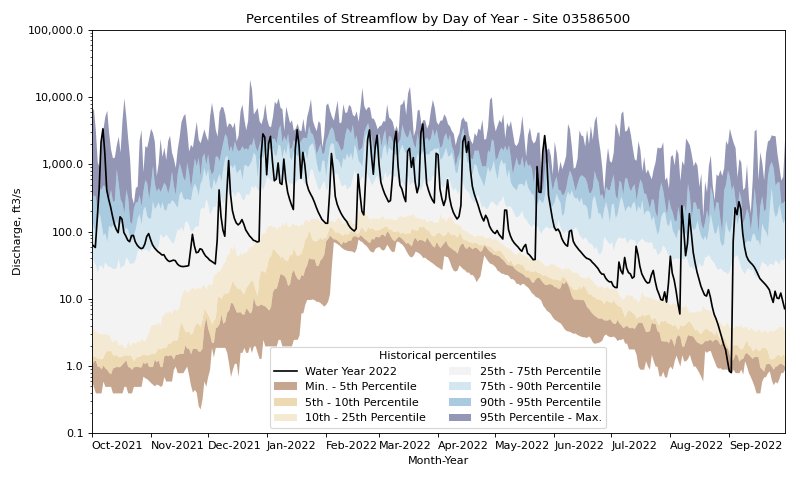 |
|---|
| Example streamflow duration hydrograph as generated by the hyswap package |
As an aside, I was also developing simple Python tooling to visualize USGS water data. The just-graphs package itself is not yet released, but the FastAPI API I developed and served via Posit Connect is available here and can be used to generate instantaneous value (iv), daily value (dv), and groundwater level graphics for USGS monitoring sites.